Building an AI-Assisted Weekly Reporting Workflow Without Engineering Help
You can automate your entire weekly report in under 20 minutes without coding.

Businesses have adopted AI faster than they've figured out what to do with it. That is the honest read of the current state of enterprise reporting, where the tools sit installed, the licenses are paid for, and most weekly reports still get built by hand, in a spreadsheet, on a Sunday night. This piece lays out the actual sequence for closing that gap, using no-code tools that a marketer, an ops lead, or a sales manager can set up without ever filing an IT ticket.
What the productivity evidence says about automating report generation
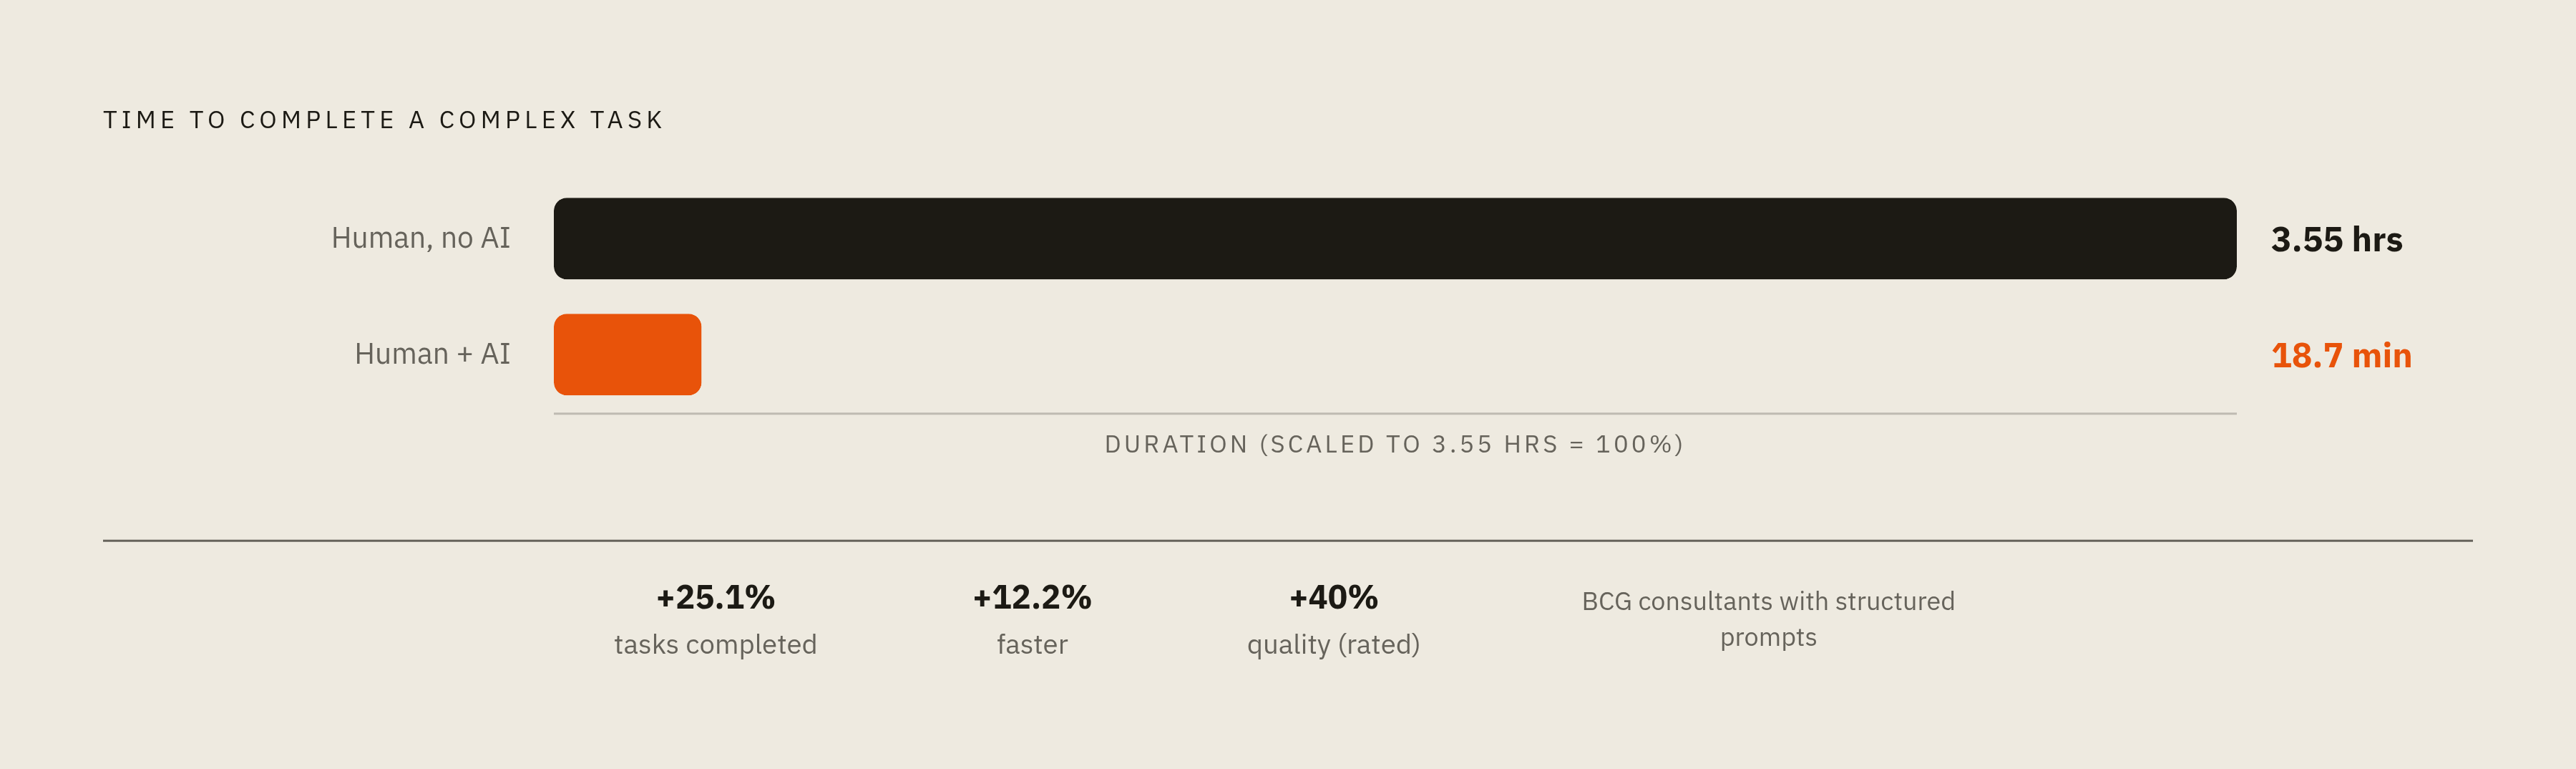
The starting number is stark enough to sit with for a second. Research on complex task completion found that when humans work solo, the average time to finish runs 3.55 hours. Adding AI assistance and a properly structured prompt drops that number to 18.7 minutes. A speedup like that represents a different category of work entirely, not a marginal efficiency gain.
Weekly report generation matches the profile this research measured almost exactly: repetitive, high-volume, and light on judgment calls that require a human in the loop. Pulling numbers from a CRM, summarizing what changed, flagging outliers, and writing a paragraph of narrative around a chart is not a task that rewards creative reasoning. It rewards consistency and speed, which automation supplies well.
The pattern holds in adjacent research too. A 2025 Harvard Business School study of BCG consultants found that those using AI completed 25.1% more tasks, worked 12.2% faster, and produced outputs rated 40% higher in quality than consultants working without it. Quality and speed rising together cuts against the assumption that automation trades one for the other.
By early 2026, agentic systems running multiple AI processes in parallel had pushed report generation time down another 30 to 50%, according to industry data, with 68% of teams reported using some form of predictive quality assurance layered onto the process. And the investment case isn't a slow burn either: Kissflow data put 60% of organizations recovering their automation investment within 12 months, alongside productivity gains in the 25 to 30% range and error reductions between 40 and 75%.
None of this is a long-horizon bet requiring a fiscal year of patience. The gains appear within weeks in two forms: less time spent building the report, and a report that catches things a tired analyst might miss on a Friday afternoon.
The four layers every no-code reporting workflow needs before you touch a single tool
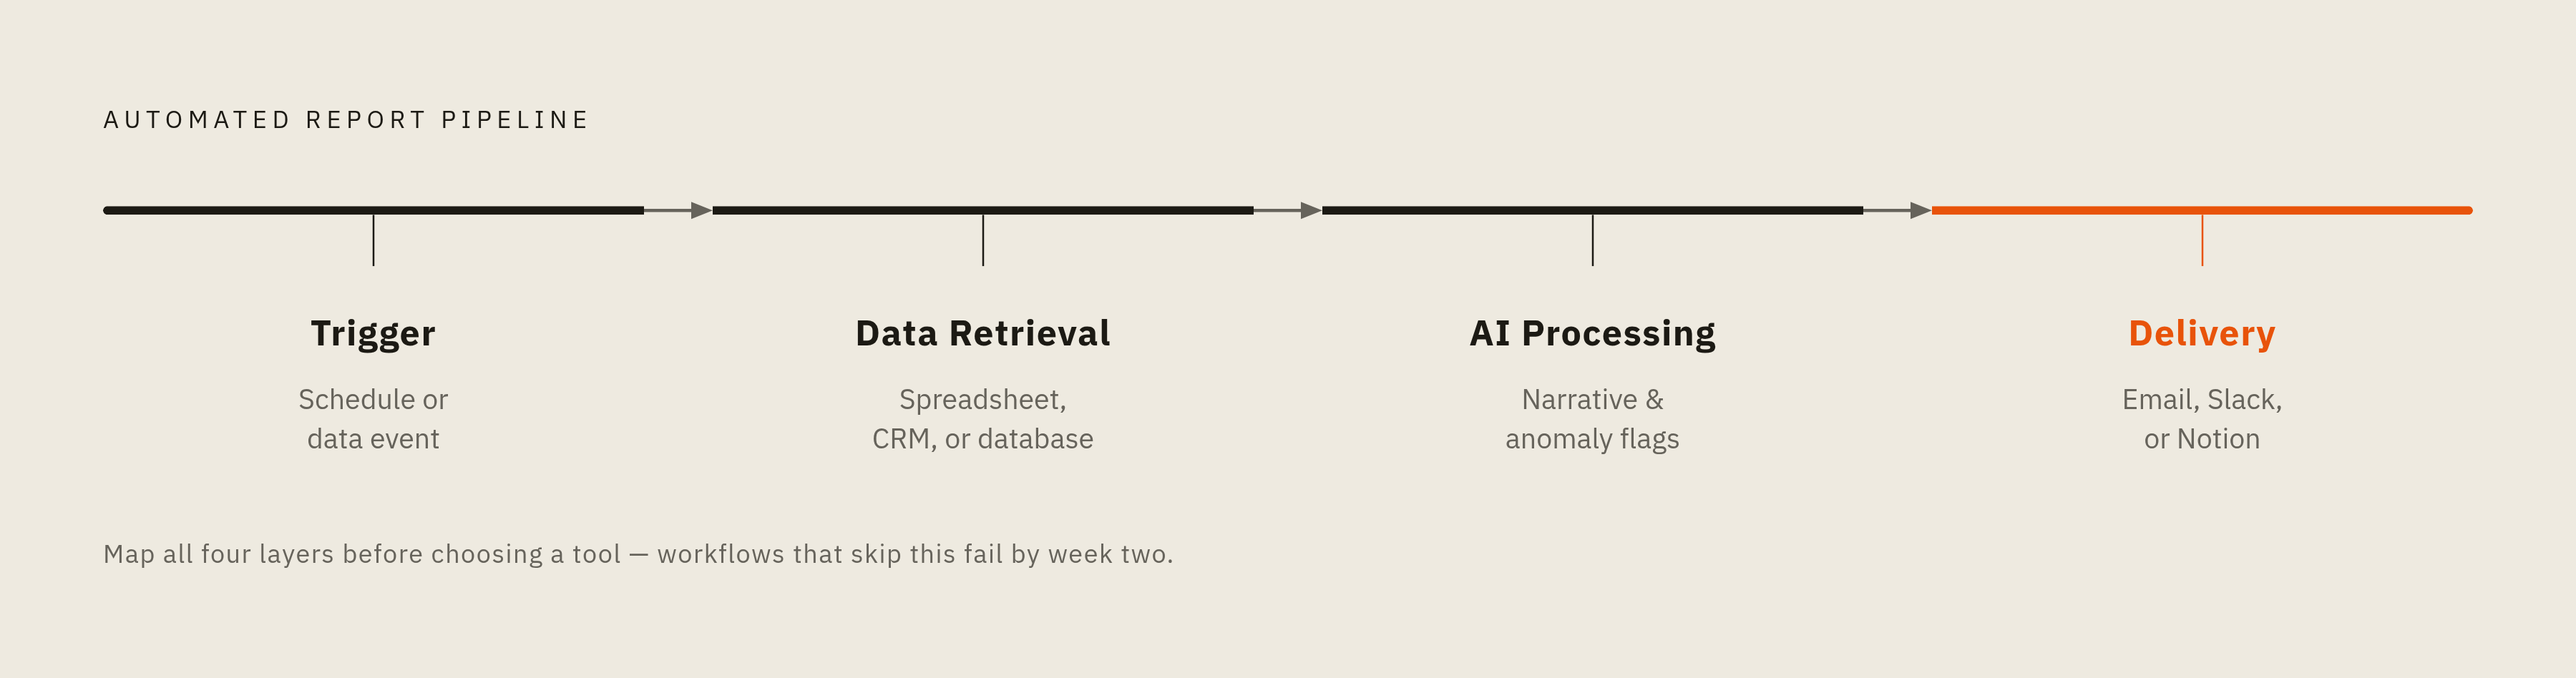
Before opening any tool, it helps to have a mental map of what a reporting workflow is actually made of. Stripping away the branding, every no-code AI pipeline reduces to four layers.
The trigger is what starts the workflow, either a schedule (every Monday at 9am) or a data event (a new row appears in a spreadsheet). Data retrieval is where the source information lives and how it gets pulled into the pipeline: a spreadsheet, a CRM export, or a database query. AI processing reads the data and produces the narrative, the summary, the flagged anomaly. Delivery is how the finished report reaches a human: an email, a Slack message, or a page in Notion.
Most no-code platforms bundle all four layers into a single visual canvas, which is convenient but also a little deceptive. It's easy to pick a tool because the interface looks clean and only discover three weeks in that it can't reach your CRM, or that its AI node caps out at a token limit your weekly data blows past. Knowing the four layers ahead of time means checking each one against a candidate platform before committing, not after.
Generative AI's promise to improve process automation efficiency by 25% or more, a figure that leaders themselves cite at 79% belief, depends entirely on that workflow logic being defined clearly before automation touches it. Automation amplifies whatever process it's given. A vague or undefined process fed into automation comes out amplified in its vagueness.
So before selecting a platform, a business user needs honest answers to a short set of questions. Where does the source data actually sit, in one spreadsheet or scattered across a CRM and a database? How often does it update, and does the report need real-time freshness or is a weekly snapshot enough? Who reads the report, and what format do they actually open, an email, a Slack channel, a shared doc? And what decision is this report supposed to inform, because that's the only real definition of what a "good" output looks like.
It's a practical safeguard. A workflow that survives contact with real use keeps functioning after the second week, while one that isn't built well dies quietly by then. Only 5% of enterprise AI pilots make it into production, and the primary reason is the gap between something that works once, in a demo, and something that keeps working without a person babysitting it. Defining requirements before touching a tool is the single factor most correlated with crossing that gap.
Choosing your orchestration platform: what each major no-code option is built for
Once the four layers are mapped against your own data, tool selection is a matter of fit, not taste. The first filter isn't interface polish, it's connector coverage: 46% of product teams cite lack of integration with existing tools as the biggest thing slowing down their ability to ship AI features. If a platform can't talk to the systems already holding your data, nothing else about it matters.
After connectors, the filters that actually separate the major options are cost predictability, how flexible the trigger logic is, how mature the automated data-analysis node is, and how fast a non-technical person can get from zero to a working first workflow.
Zapier is the strongest starting point for non-technical teams building event-driven automations across mainstream SaaS apps. It carries the largest connector catalog of the major platforms, requires minimal setup, and its 2026 update added "Smart Zaps," AI-powered multi-step automations. Its AI Copilot feature lets a user describe a workflow in plain English and have Zapier construct the Zap automatically, which is about as close to zero-config as no-code currently gets. It's also the natural home for the Google Sheets, ChatGPT, and Slack pattern covered in the next section.
Make is built for a different job: ops teams running high-volume workflows with a lot of branching logic, where the ability to visually trace how data routes through the pipeline matters more than getting started in five minutes. Make's canvas handles complex data manipulation and conditional routing well, though the learning curve sits noticeably higher than Zapier's. What it buys in return is more deterministic behavior once a workflow scales past a handful of steps.
n8n serves teams that want to self-host, avoid usage-based pricing, and run automations at volume without a per-task cost attached. It's more accurately described as low-code than no-code: some of its node logic expects a bit of developer instinct, and it won't deliver the fastest first-workflow experience of the three. But where data residency requirements or cost-at-scale make cloud platforms impractical, it's the right call.
Embedded AI in your existing productivity suite: Copilot vs. Gemini for report work
Before reaching for a separate orchestration platform, it's worth asking whether the AI already sitting inside your existing productivity suite is enough. The deciding principle is simple: match the assistant to the suite your data already lives in. An organization running on Microsoft 365 should default to Copilot; one running on Google Workspace should default to Gemini. The native integration advantage outweighs feature-by-feature comparisons for most reporting use cases, and Microsoft's installed base gives Copilot a considerable head start, with a large majority of Fortune 500 companies already using Microsoft's generative AI platforms.
For reporting specifically, the two assistants play to different strengths. Copilot in Excel is the more mature option for finance and operations reporting: formula generation, pivot table construction, and Excel's Power Query surface combine into a stronger toolkit for structured, tabular data than Gemini currently offers inside Sheets. Gemini's advantage runs the other direction, toward its long-context window. Long contracts, lengthy Docs, and extended data sets can be summarized in a single pass without needing to be chunked into pieces first. Copilot has narrowed that gap through semantic indexing, but for genuinely long single-pass context work, Gemini still leads.
Pricing, as of mid-2026, sits close enough to be a wash. Google AI Pro with Gemini 3 Pro runs $19.99 a month. Standalone Copilot Pro runs $20. Microsoft 365 Personal bundles Copilot with Word, Excel, Outlook, and cloud storage at a lower monthly price point, and for many individual users that bundle is the more sensible entry point than either standalone product.
The honest answer for when embedded AI is enough: one-off summaries, ad-hoc analysis, drafting a paragraph of narrative around a chart already open on screen. The honest answer for when it isn't: anything that needs to run on a schedule, anything pulling from more than one data source, anything that needs to land automatically in Slack or another endpoint without a human clicking a button. That's the line where orchestration platforms take over.
Building the core workflow step by step: Google Sheets, ChatGPT, Zapier, and Slack
The most widely used no-code pattern for weekly reporting follows a simple chain: trigger on a schedule, pull data from a spreadsheet, process it with ChatGPT, and route the output to Slack. Each piece is independently swappable once the four-layer model makes sense, but this combination is the one worth building first because every part of it is well-documented and forgiving of mistakes.
Start with the trigger. Inside Zapier, "Schedule by Zapier" set to run every Monday at 9 AM is the cleanest choice for a weekly cadence. A time-based trigger beats a data-event trigger here because it decouples the report's timing from whatever unpredictable moment the spreadsheet happens to update. Reports go out on Monday morning regardless of when the last row got added. Paid Zapier plans check for updates more frequently than the free plan, a detail that matters later if the workflow shifts toward event-based triggering instead.
Next comes retrieval. Google Sheets slots in as the first action after the trigger fires, using the "Get many spreadsheet rows" event, which returns up to 500 rows as a single JSON object, a format ChatGPT parses cleanly without extra formatting work. The decision that actually matters here isn't technical, it's which rows to pull: all of them, a date-filtered range, or a specific named range. Settling that before building keeps the data shape predictable every week, instead of guessing at what showed up in some row further down the sheet.
Then the data hits ChatGPT. Add a ChatGPT action step and pass the JSON output from the Sheets step in as the user message. The mechanical part of this step is trivial, Zapier just relays the data forward. Whether the resulting report is useful or generic actually depends on the prompt sitting underneath it, which is the subject of the next section. API response times are typically fast, so total runtime for a standard weekly report lands in minutes, not hours, even with the spreadsheet pull and the Slack delivery included.
Writing the prompts that make AI summaries useful for your audience
The platform and the data pipeline matter, but prompt quality is what actually separates a report worth reading from a wall of machine-produced filler. Prompt engineering, at its core, is a communication skill: writing instructions specific enough that a model interprets them the way you intend. It doesn't require a technical background. A sales rep, a marketer, a project manager, and a customer service lead can all learn it, because the skill being exercised is clarity.
A prompt that just says "summarize this data" will produce a summary. It won't produce a report that answers the specific question a VP of Sales actually has on Monday morning, which is closer to "did we miss quota, and why." Getting from a generic summary to a targeted answer means telling the model who's reading the report, what decision they're making with it, what format they expect (bullets, a short narrative, a table), and what threshold counts as noteworthy versus routine. A prompt that specifies "flag any metric that moved more than 10% week over week, and explain the likely driver in one sentence" will produce something genuinely useful. A prompt that just asks for a summary will produce something that reads fine and says nothing.
The gap between those two outcomes comes down to something else. It's about whether the person writing the prompt has actually thought through who the report is for and what they're going to do with it once they read it. That's the layer no orchestration tool can automate away, and it deserves real time before calling any weekly reporting workflow finished.