Natural Language to SQL for Analysts Using Google Sheets Data
AI now lets analysts query spreadsheet data using plain English instead of learning SQL syntax.
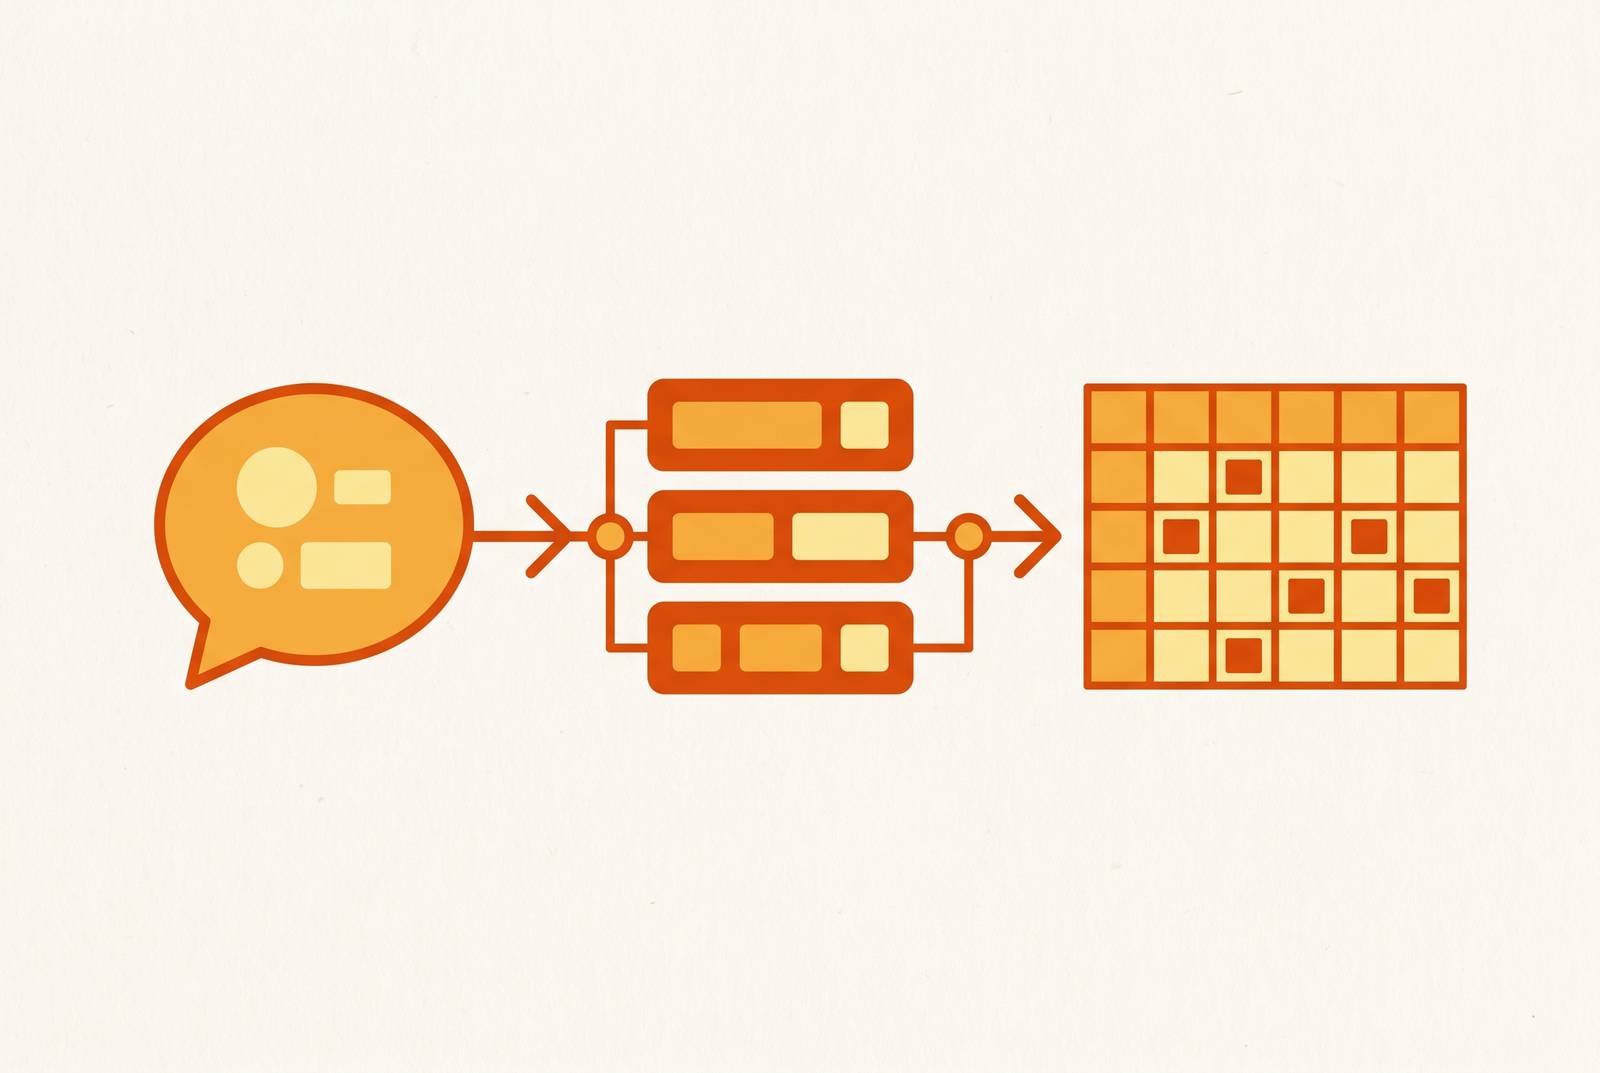
SQL still runs the data analyst job market, and most of the people who need answers from data can't write it. That gap is the whole story here: SQL dominates the data profession, yet only about 23% of business users can write even an intermediate query. Analysts absorb the difference. They spend somewhere between 60% and 80% of their working hours writing and debugging queries because someone in marketing wants "sales by region for active customers last quarter," and there's no way to get that answer without a person who knows WHERE clauses standing between the question and the number. Google Sheets, as of 2026, is one of the places that gap is finally starting to close, and the mechanism is natural language translated into something closer to SQL, sitting right inside the cells people already work in.
What Google Sheets can do with data in 2026, and where its hard limits sit
Three things changed Sheets in the space of about eighteen months. Gemini stopped being a sidebar novelty and became a native part of the cell grid, callable as a function. Connected Sheets opened a real pipe into BigQuery, so a spreadsheet can sit on top of a dataset that's actually stored at warehouse scale. And a third-party add-on market grew up around both of those, filling in gaps Google's own tools leave open.
None of that erases the ceiling that's always been there. Sheets caps out at a fixed number of cells per spreadsheet, and that ceiling gets easier to hit than it sounds, especially once a workbook has several tabs of transactional data with a dozen or more columns each. Past that point, formulas lag, charts stop rendering cleanly, and scheduled refreshes fail. The new AI functions bring their own quotas on top of that, and bulk processing across thousands of rows in one pass can run into rate limits that have nothing to do with the cell cap.
None of this makes Sheets a lesser tool. For an individual analyst, a small team, or anyone who doesn't need a dedicated data warehouse, Sheets covers the overwhelming majority of day-to-day analysis. The honest framing is knowing which side of the 10-million-cell wall your dataset actually lives on, and building accordingly.
The QUERY function as a pseudo-SQL layer that AI makes approachable
QUERY is the closest thing Sheets has to a SQL engine baked into a formula. It takes a range and a clause written in a query dialect resembling that of a database engine, SELECT, WHERE, GROUP BY, ORDER BY, LIMIT, PIVOT, LABEL, and returns a live result set that updates as the source data changes. It is not full SQL. There's no SQL-style join support the way a database engine would handle it, no subquery support in the way a real database handles it, and the syntax has its own quirks around date literals and string quoting that trip up people who already know standard database query languages.
What AI changes here is the barrier to using QUERY's underlying capability. It's the barrier to using it. An analyst who can describe, in plain terms, "show me last month's sales by region, only active customers, with totals and average sale" already knows exactly what they want. What they often can't do from memory is write the clause correctly, get the column references right, and remember whether GROUP BY needs to repeat the aggregation columns.
Feeding that same plain-English request to Gemini inside Sheets, something like "create a Google Sheets QUERY formula that groups this table by Region, filters for Active customers, and returns total sales and average sales," maps back to a working formula: =QUERY(A2:E1000, "SELECT B, SUM(E), AVG(E) WHERE C = 'Active' AND A >= date '2025-04-01' GROUP BY B ORDER BY SUM(E) DESC"). The AI handles the column-letter mapping and the clause construction. The analyst still owns the job of checking that the output is actually correct, because an AI-generated formula can return a plausible-looking wrong answer with no indication anything is off.
Range dependence, hardcoded assumptions, and inconsistent categorical values are three failure modes common enough to name directly. Range dependence is the first: AI-generated formulas tend to lock in a fixed range like A2:E1000, which quietly stops covering new rows the moment the dataset grows past row 1000. Named ranges, or open-ended references like A2:E, fix this by letting QUERY track the data as it expands. Column-mapping confusion is the second, and it's sneakier: the AI maps columns by position, so if someone inserts a column or reorders the sheet, the formula keeps running but starts pulling the wrong field into the wrong slot, with no error thrown. And performance is the third. A QUERY formula scanning tens of thousands of rows, especially one stacking multiple PIVOT or LABEL clauses, will visibly slow the sheet down. Pre-aggregating the raw data in a staging tab before running the final QUERY against it solves most of that.
Native Gemini features inside Sheets: what the =AI() function, the sidebar, and Explore each do
Three separate Gemini surfaces live inside Sheets now, and they do different jobs.
The =AI() function runs a language model call directly inside a cell, no add-on required. It's built for text work: summarizing a block of notes, scoring sentiment on a column of customer feedback, tagging rows into categories, or pulling structured fields out of messy free text. It can run across hundreds of rows in one pass, which makes it genuinely useful for something like bulk-categorizing expense line items or scoring a batch of product reviews for tone. As of 2025, it works across a wider set of languages too, including Spanish, Portuguese, Japanese, Korean, French, Italian, and German, among others. Core Gemini features ship in standard Workspace plans, though some of the more advanced functionality sits behind higher tiers. =AI() only sees data that's already sitting in the sheet, which limits it to whatever has already been entered there. It doesn't reach out to a live system to fetch anything new.
The Gemini sidebar works more like a conversation. Ask it "what's the trend in sales over the last six months?" and it comes back with chart suggestions and a written read on what the numbers show. It can also chain instructions together in a single request, delete archived rows, apply conditional formatting, add a notes column, all from one prompt. Beyond that, it's a decent assistant for formula suggestions, chart-type recommendations, generating a first-pass pivot table, and flagging data that probably needs cleaning.
Explore, tucked in the bottom-right corner of the sheet, is the oldest of the three and the most passive. It scans for patterns automatically, trends, outliers, seasonal swings, and suggests pivot tables based on what kind of data it's looking at. It also answers simple natural-language queries like "average sales by region" instantly. It's a solid first pass for exploring a new dataset. It is not built for complex, multi-table analysis, and it doesn't pretend to be.
None of these three replace a real NL2SQL pipeline for an analyst working against a large or multi-table schema. They speed up the work already happening inside a single sheet. They are not database query engines, and treating them as one is where trouble starts.
Connected Sheets and BigQuery: how the native NL-to-SQL bridge works at scale
Connected Sheets bridges Sheets into warehouse-scale data. It lets an analyst point Sheets at data sitting in BigQuery or Looker and interact with it using pivot tables, charts, and formulas that feel exactly like native Sheets tools. BigQuery does the heavy computation behind the scenes; Sheets stays as the presentation and interaction layer on top.
One practical pattern that emerges with Connected Sheets is that a team can pull trend analysis across multiple dimensions without touching a line of SQL. Repivoting a view means dragging fields around in a Sheets pivot table, while BigQuery processes the underlying data behind that pivot in seconds rather than hours.
That's a meaningful jump in what a spreadsheet can do. It doesn't solve everything, though. Connected Sheets still requires that BigQuery already exist and be set up. For a team whose data lives entirely inside spreadsheets, with no warehouse behind it, this path doesn't apply.
Third-party tools that add NL2SQL capability to Sheets-based workflows
This entire category is new enough that most of it didn't exist two years ago. It now spans in-cell AI add-ons, formula generators, agentic analysts running on SQL backends, and standalone NL2SQL clients that plug into a spreadsheet as one of several outputs.
Coefficient syncs live data from CRMs, databases, and ad platforms into Google Sheets on a set refresh schedule, and layers AI on top to write formulas and SQL and to build out charts and pivots automatically. It's used by more than 350,000 professionals, and it fits best for analysts whose Sheets workflow depends on external data staying current without manual re-exports.
Querri bills itself as an "AI Data Analyst." Upload a spreadsheet or connect a data source, ask a question in plain English, and it returns visual insights and dashboards with very little setup work. It has a free tier, and paid plans run roughly $20 to $50-plus a month depending on usage limits, dashboard count, and team seats.
Formula Bot has over a million users, including teams at Fortune 500 companies, and offers a free Excel Formula Generator alongside an SQL Query Generator. The entry cost is low, which makes it an easy first tool for someone testing whether NL2SQL fits their workflow before committing to something heavier.
What benchmark accuracy numbers mean for analysts and where they break down
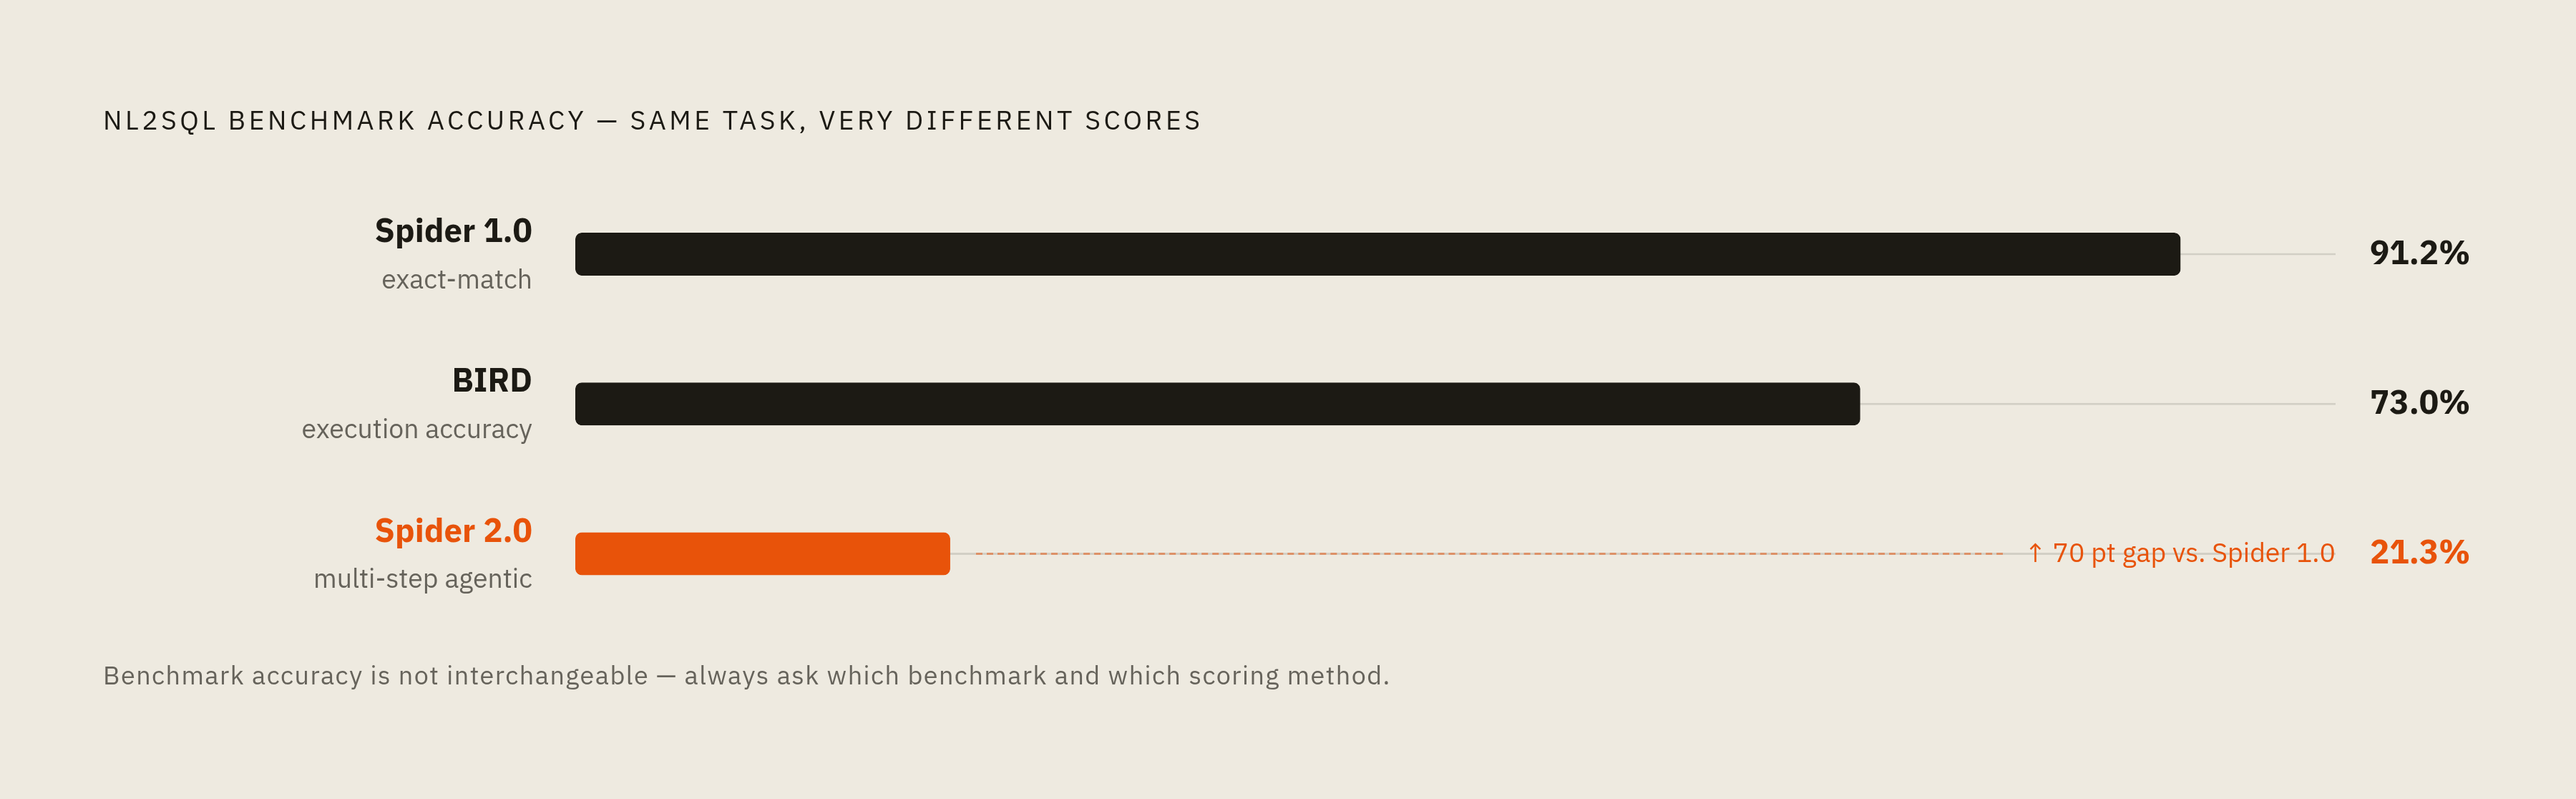
Vendors quote accuracy numbers, but they measure very different things depending on which benchmark produced them. General-purpose language models hit roughly 85% execution accuracy on Spider 1.0, a clean, academic benchmark. On Spider 2.0, built around enterprise-grade schemas with hundreds of tables, accuracy for the same class of models drops to somewhere between 10% and 21%, a discrepancy that means a tool can look production-ready or clearly not depending entirely on which test you trust. That's a gap of several dozen percentage points between the two benchmarks. Whether a tool looks production-ready or clearly isn't depends entirely on which test you trust.
The benchmarks themselves aren't measuring the same thing. Spider pairs 10,181 questions with 5,693 complex SQL queries spread across 200 databases and 138 domains. BIRD covers 12,751 natural-language-to-SQL pairs across 95 databases pulled from 37 specialized domains, and runs around 73.0% execution accuracy. Spider 1.0, evaluated under exact-match scoring, reaches close to 91.2%. Spider 2.0, evaluated under a multi-step agentic process closer to how a real analyst actually works, is around 21.3%. Quoting one of these numbers without saying which benchmark and which evaluation method produced it is close to meaningless.
Model-level numbers from July 2025 tell a similar story of spread rather than consensus: Grok-3 at 80% on complex queries, GPT-4o at 72% on general-purpose tasks, DeepSeek-R1 at 71% on enterprise database queries, Claude Sonnet at 68% on business queries. None of these numbers come from the same test conditions, so ranking the models against each other from this alone would be a mistake.
A harder problem underlies both benchmarks: a paper presented at CIDR '26 found systematic annotation errors running through both BIRD and Spider 2.0-Snow. A paper presented at CIDR '26 found systematic annotation errors running through both BIRD and Spider 2.0-Snow, spanning multiple error patterns including mismatches between the question and its underlying logic, gaps in domain knowledge baked into the annotations, and ambiguity in what the question was actually asking. One flagged BIRD annotation turned out to be wrong simply because the person who wrote it didn't understand the domain well enough to write a correct answer key. If the benchmarks used to score these models carry errors like that, every accuracy number built on top of them needs to be read as an estimate, not a fact.
Structuring Sheets data so the AI produces reliable output
Every failure mode covered so far traces back to one root cause: the AI has to guess what a column means, how two tables relate, or what a business term is supposed to map to, and it guesses wrong. Schema clarity is the single biggest lever an analyst actually controls here, and it's also the one most consistently ignored.
Start with headers. They need to be plain English, consistent across the sheet, and specific: "CustomerStatus," not "Stat," "SalesAmount," not "Col E." Merged cells, multi-row headers, and stray blank columns all break the range assumptions that formulas depend on, and an AI-generated formula that maps columns by letter position will keep running after a column shift, quietly pulling the wrong data into the wrong slot with no warning. Named ranges are the fix, and they're worth the five minutes it takes to set them up.
Data types matter just as much as naming. A date column needs to hold actual date values, not text strings formatted to resemble one, or WHERE clauses built around date ranges will silently fail to match. A numeric column with "N/A" typed into a few cells is no longer a numeric column as far as QUERY is concerned. Categorical fields need a controlled vocabulary too: if CustomerStatus is entered as "Active," "active," and "ACTIVE" across different rows, a WHERE clause filtering for one exact string will miss the other two, and nothing in the output will tell anyone that rows went missing.
Documentation the AI can actually see closes the loop. A short data dictionary tab, listing what each column holds, its expected type, and any coded values it uses, gives the model something concrete to check its own output against instead of pattern-matching off column names alone. None of this is glamorous work. Whether a QUERY formula is right once by luck or keeps being right as the sheet grows depends on this same groundwork.